Impact of power factor on billing: Technically there are two components of power consumption known as active and reactive power. Both components are billed by some of DISCOM for large/commercial consumers depending upon the tariff approved. In Maharashtra, HT consumers are charged tariffs based on the consumption of active and reactive power or kVAh.
In this entire article, we are ignoring harmonics, which is another big topic in itself, which has a direct effect not only on HT consumers but also LT (commercial, industrial, service) as per approved tariff.
Change in billing from kWh to kVAh: Let us understand the change in billing from kWh to kVAh and the effect on bills due to this change taking place. Following table shown below gives a brief idea as to how the calculation of kWh and kVAh is being done (reference: MERC Tariff Order)
kWh billing: kVAh = SQRT((kWh^2)+((RkVAh)^2))
kVAh billing: kVAh = SQRT((kWh^2)+((RkVAh.Lead+ RkVAh.Lag)^2))
A simple example illustrates the difference between two concepts in the billing
| Particulars | kVAh billing | kWh billing |
| kWh | 10,000 | 10,000 |
| RkVAh – Lead | 3,500 | 3,500 |
| RkVAh – Lag | 1,500 | 1,500 |
| RkVAh – Total | 5,000 | 2,000 |
| kVAh | 11,180 | 10,198 |
| PF | 0.894 | 0.981 |
| PF Credit | 0% | -1.5% |
| Billing Units | 11,180 | 10,000 |
As per above with the same units, under kWh billing, a customer was eligible for a credit of 1.5%, while under kVAh billing the billing unit is increased from 10,000 to 11,180 or an increase of 11.80%. Whopping rise, isn’t it?
kVAh billing in India: Historically electricity bills used to have a penalty of credit for maintaining PF applicable for consumers with specific load/category of uses. In some of the states instead of credit/penalty for maintaining PF at a certain level, the billing has changed to kVAh instead of kWh.
MSEDCL HT consumer’s PF management: How well have Maharashtra consumers improved since kVAh billing started in April 2020? Well, here we are going to analyze the status of HT consumers in MSEDCL who managed their power factor from Jan 2021 to Nov 2021. Since the data are for Maharashtra State (excluding certain areas of Mumbai), the data become valuable for the industry to learn from these data. So far these data are used or analyzed to help the industry make its members know and understand the potential of this specific aspect and how it is an ignored area of active management.
- Power factor maintained at various load levels by MSEDCL HT customers from Jan 2021 to Nov 2021- Here in this study, we excluded HT consumers whose contract demand is less than 200 kVA, which are 34% of total MSEDCL HT consumers:
- Above 10000 kVA, there are few customers, however, on load, there is still a problem managing PF at 100000 kVA, which surprising.
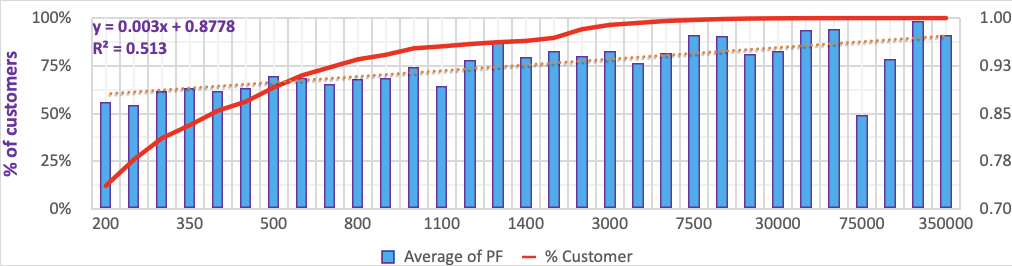
- The majority of HT customers have loads of less than 2000kVA, therefore detailed analysis is done separately.
- R2 value as per linear equation is 0.513, which is quite poor, and shows wider fluctuation and disparity in PF level managed at various CD levels. This is again as we have covered a wider range from 200 kVA to 350000 kVA.
- The dotted line for trend marking is almost fitting at all CD levels with little difference. This shows CD level affects PF-managed change in line with the level change.
- Consumers with a CD of 450-900kVA have around 0.90 levels of PF and are facing cost increases by around 10%, which is very big. These consumers up to 500kVA are almost 2/3 of consumers covered in the study, which is very big and surprising.
- The increase of cost by around 10% means the majority of these consumers are the ones generally missing capable technical teams, the non-technical background of owners, and PSU/government/ semi-government/ AG/ railway consumers.
- Above 10000 kVA, there are few customers, however, on load, there is still a problem managing PF at 100000 kVA, which surprising.
- A close look at MSEDCL HT consumers having contract demand between 200 kVA – 2000 kVA: Some interesting underlying facts in respect of HT consumers with load from 200 kVA to 2000 kVA are given below:
- 95% of total HT consumers are within this range from 200 kVA to 2000 kVA, while only 5% of consumers with loads over 2000 kVA.
- In this category, the majority of customers are MSMEs. Since the repeated lockdowns in COVID, there has been huge stress on MSME units. Therefore, PF management for MSMEs become much more critical.
- The linear trend line marked in red with the equation is also marked for a better understanding of the data in a chart.
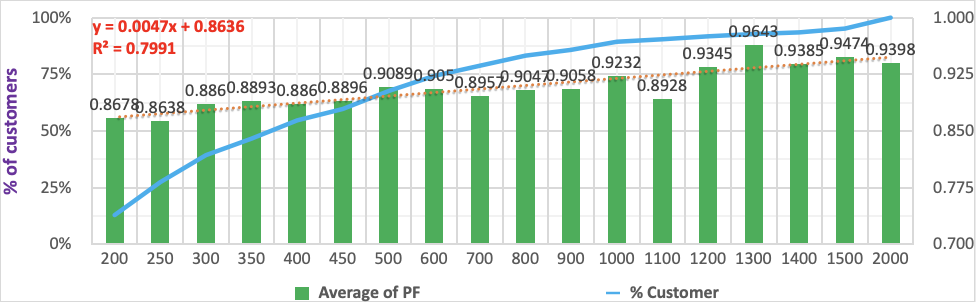
- The chart shows while on a lower level, the average billed PF is very low @ 0.868 and moves up gradually and at 800-900 kVA touches 0.900+.
- R2 value as per linear equation is 0.799, much better than the first table which was 0.513, which indicates good co-relation between load and PF at various levels. This also implies that as the load goes up average PF will improve. As the load increases, the bill also increases and high-value customers are expected to have technical staff and more awareness of owners to keep PF at a good level to control the power cost.
- Even at a higher level, some customers are not bothered by PF management. These are mostly expected under the government department, railway, AG pumping, PWW, etc.
- Analysis of high-load consumers having contract demand between 10000kVA-60000kVA to show the quality of PF management: These are ultra-high-power cost consumers having an annual cost of Rs 100-200 crores or more so, it is expected that they are supposed to be well managed. However, let us see if this is the case…… Here we need to look at the PF, standard deviation, and variation between min, max and average PF:
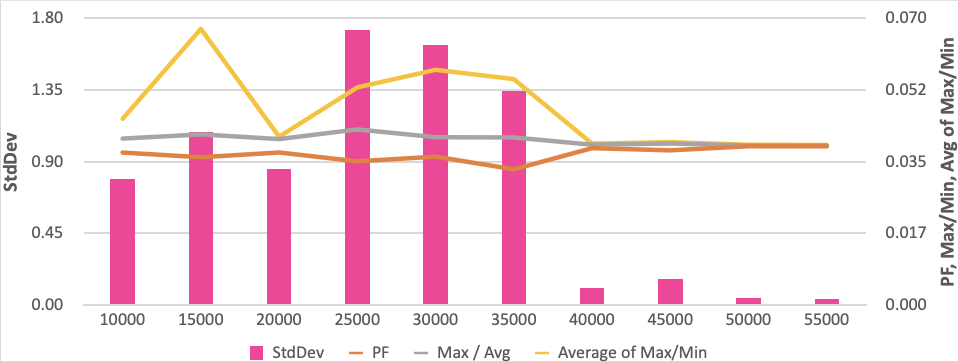
- PF with a standard deviation of average PF, ratio of Max/Avg PF, and Max/Min PF is shown in the chart.
- The chart shows that consumers with 40000-55000kVA manage far better consistently compared to consumers with loads between 10000-40000kVA.
- Customer with loads 40000-55000 kVA are far better compared to 10000-35000 kVA, who have less variation in their average PF managed in 11 months and show consistency if average PF, which is apparent from high StdDev reported.
- The Max/Avg & Max/Min ratios show fluctuation in average PF achieved, which is at a comparatively good level. The higher the ratio, the higher the fluctuation and the higher the average cost of missing PF to pure unity.
- This shows another critical aspect of PF management that even at such an extremely high level, PF is not managed consistently.
- Analysis of HT consumers having an average PF of 0.900 or more whose contract demand is between 200 kVA to 2000 kVA: In this section, we will study consumers who are 68% of the table at point 2 who can maintain PF 0.900 or more and their behaviour in respect of maintaining and managing PF and its consistency.
- In this, we noted that 68% of consumers are the ones whose average PF of 11 months is 0.900 or more.
- Consumers managing an average PF of 0.985 or more is much less as shown in the table above. From 0.90-0.98, there are 71% consumers but above 0.98 are only 29% consumers. Between these two sets of consumers, 0.98+PF has less variation in average PF as well.
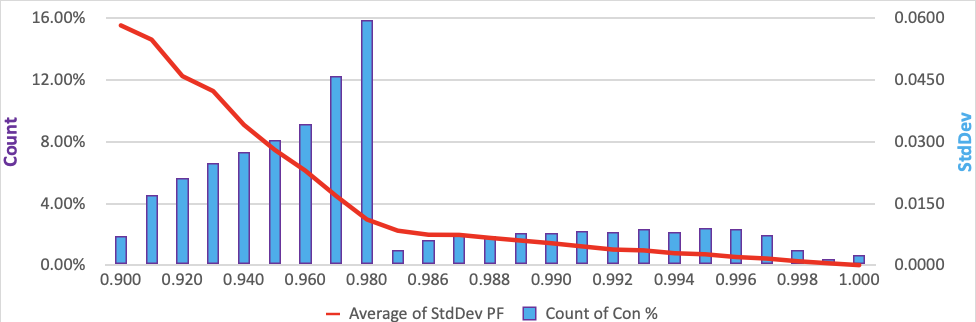
- In addition to average PF, minimum and maximum PF was also taken. The standard deviation of the average PF was added to the chart.
- The standard deviation of an average PF shows an interesting fact that above 0.985 PF, customers are maintaining and managing the PF much more systematically and therefore the standard deviation of an average PF of this customer dropped.
- Big question – Why PF is not consistently maintained? It is really disheartening to note that consumers are not able to maintain and manage the PF. A brief discussion on the issue is discussed in detail based on the detailed discussion we have noted in previous points:
- Several consumers purchased new APFC since the new tariff for HT consumers started in April 2020, which we have noticed during our several customer visits.
- However, unfortunately, still they have 1%-3% extra billing units, despite incurring lakhs within 2-3 years of the previous installation in Sept 2018 tariff change, which demands active PF management.
- Active PF non-management issue is not in Maharashtra alone, but the entire country. The large customer merely looks at say 0.993 or 0.997, without going into the nitty-gritty, leaving the scope open unattended.
- Efforts were made to understand why this issue is there with respect to continued managed PF. Visiting numerous installations, and checking ways and other means were adopted in the process to maintain and manage the PF.
- The root cause noted is mainly on account of the selling approach adopted by most APFC vendors, who are bothered to demonstrate PF within the first 1 to 2 (or max 3) months, however thereafter, they disappear or generally would give excuses or may take some actions including replacement of few capacitors, but the problem continues. The problem is compounded as a majority of consumers (MSME) either don’t have well experienced technical team or owners do not have the technical background to understand the issue.
- There are several issues which require careful analysis and evaluation while APFC configuration are being decided, however, we have seen
- vendor quote based on one latest bill of consumer
- vendor quotation without detailed technical details instead giving one line like “APFC with 210 kVAr”etc.
- vendor quotation without the proper design of all components, which requires careful selection by technical experts having knowledge and expertise and understand the impact, but this is ignored as most of customer/owner and plant staff does not have relevant diagnostic capability to ask for the same and inferior design are accepted
- negotiation by a customer with vendor based on only cost without checking technical configurations
- vendor/customer relying to improve PF only on APFC system, ignoring systematic management, which requires regular efforts.
- The most important aspect of buying APFC, it fails to deliver the output desired systematically, where systematic working can help to maintain and manage the PF, but very few consumers (<.5%) work on the same. They fail to understand that capacitor de-ration is unavoidable and there are other issues as well. This is based on review, checking and analysis of several consumers. This applies not only to small consumers but also to large consumers with a load of 10000 or 100000 kVA. If systematic work is undertaken, PF can be controlled to a good extent.
- Summary outcome of analysis: Let’s summarize the findings of this analytical review for quick understanding:
- With lower load/demand/consumption, the PF is not managed well due to a lack of quality team/capabilities.
- As load/demand/consumption starts increasing, the power bill goes up and owners start taking an interest, who are then being assisted by the technical teams to improve, maintain and manage.
- There is a wide variation in PF being maintained by customers. Even some of the customers with high loads fail to manage PF.
- In this analysis, we used Standard Deviation to show a change in the underlying data. To put it simply, when Standard Deviation is used and is lower, means less variation compared to average values.
- Those having lower loads have a good opportunity to reduce costs due to increased billing units. Simply as large units can manage, so why can’t they?
- The behaviour of customers with less than 0.90 average PF:
- 25% of consumers from 200kVA+ have an average PF less than 0.90.
- Average of the average PF of these is merely 0.766, which means scope to reduce cost by 25%+.
- Huge savings and these are expected to give recovery of cost within 6-12 months alone. Such returns are not expected in any business.
It is not impossible to maintain and manage the PF consistently, however, while buying the system, one must understand that it is not equipment alone but systems and practices, which can only ensure smooth operation and consistent management of PF. So one must remain vigilant of product sellers. We have used structured control reports by means to identify various issues for improving the same consistently, which is a huge scope for large consumers.
Author
CA Mahaveer Kumar
Founder and Director
E-Efficiency Management Consultancy Private Limited (EEMC)